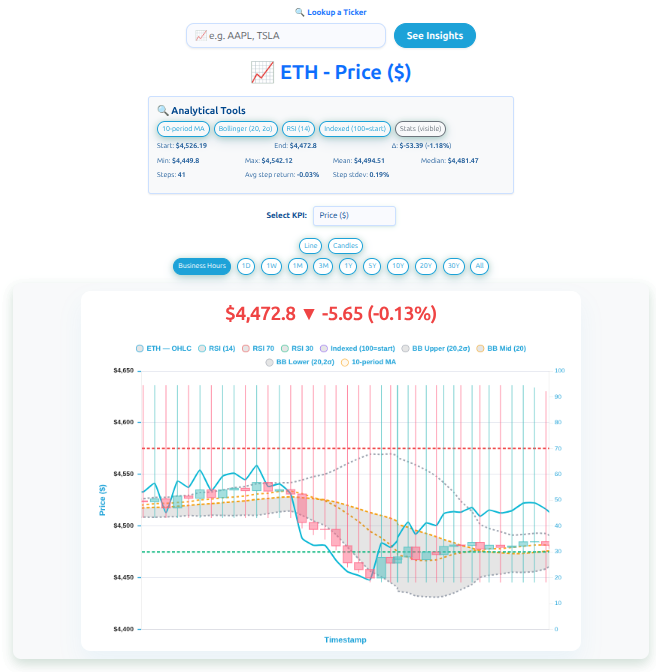
The latest data visualization highlights Ethereum’s (ETH) real-time price action, captured through Chartledge’s advanced analytics dashboard. This snapshot shows ETH trading at $4,472.80, down 0.13% (−$5.65) during the observed period.
⸻
Key Metrics at a Glance
• Start Price: $4,526.19
• End Price: $4,472.8
• High / Low: $4,544.8 / $4,448.4
• Median: $4,481.47
• Average Step Return: –0.03%
• Step Size (Volatility): 0.19%
• Steps Tracked: 41
These metrics show a narrow trading range, suggesting modest intraday volatility despite a small downward trend.
⸻
Technical Indicators in Focus
The chart integrates multiple analytical tools:
• Bollinger Bands (20, 2σ): ETH prices moved largely within the upper and lower bands, showing periods of compression that may signal an upcoming breakout.
• Relative Strength Index (RSI): Hovering near neutral levels, RSI indicates neither overbought nor oversold conditions.
• 10-Period Moving Average: The MA closely follows price action, providing a short-term trend line for traders.
⸻
Visualizing Market Movement
The candlestick chart illustrates fluctuations with clear timestamps, while overlayed Bollinger Bands and RSI readings help traders spot potential reversals.
A slight downward slope toward the end of the session hints at cautious sentiment, though the tight band spread points to a market waiting for a catalyst.
⸻
What It Means for Investors
For active traders, the current pattern reflects low immediate volatility—ideal for short-term strategies like range trading or preparing for a breakout.
For long-term holders, the small 0.13% dip is negligible, reaffirming Ethereum’s stability around the $4,400–$4,500 range.
⸻
Takeaway
This Chartledge snapshot showcases the platform’s ability to deliver high-resolution, real-time analytics for crypto assets like Ethereum. With KPIs, Bollinger Bands, RSI, and automated calculations, investors can monitor price movements, assess risk, and react to market shifts in seconds.
Track ETH and other assets in real time with Chartledge’s comprehensive analytics tools.