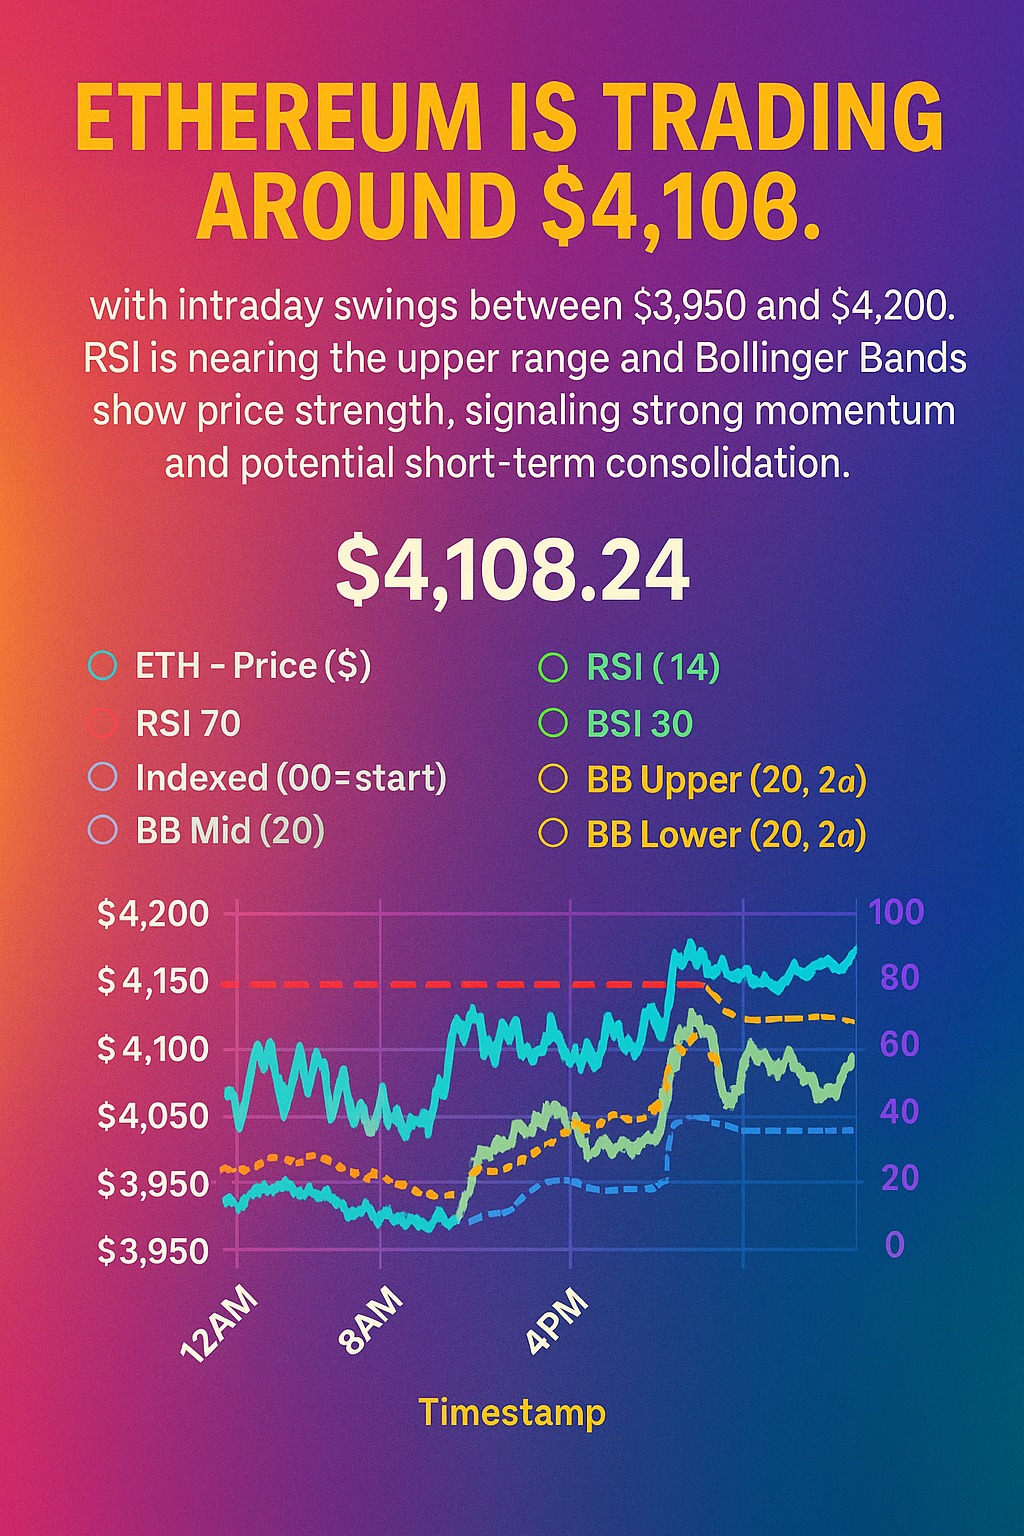
The Chartledge dashboard shows Ethereum (ETH) trading at $4,108.24, capturing a full day of activity and key market signals.
⸻
Intraday Price Movements
• Price Range: ETH fluctuated between roughly $3,950 and $4,200 over the 24-hour period.
• Trend: After a quiet early morning, ETH rallied mid-day, pushing above $4,100 before easing slightly toward the evening.
⸻
Key Technical Indicators
The chart layers several popular indicators to give traders a clearer picture:
1. Relative Strength Index (RSI 14):
• Oscillated between 30 (oversold) and 70 (overbought), peaking near the upper range during the afternoon rally.
• Current reading in the mid-60s suggests ETH is approaching—but not yet at—overbought territory.
2. Bollinger Bands (20, 2σ):
• Price hugged the upper band during the midday surge, a sign of strong momentum.
• The midline (20-period moving average) around $4,050 acted as a support level through most of the session.
3. Indexed Baseline (100=start):
• Helps visualize relative percentage change; ETH’s index remains slightly positive on the day.
⸻
Market Outlook
• Short-Term View: The upper Bollinger Band test hints at potential consolidation or a minor pullback unless fresh buying pressure emerges.
• Momentum Watch: If RSI pushes above 70 and price holds over $4,150, bullish momentum could accelerate toward new highs.
• Support Levels: The $4,000–$4,050 range stands out as near-term support if selling pressure increases.
⸻
Bottom Line
This snapshot highlights Ethereum’s continued resilience around the $4,100 mark. Active traders may watch for a breakout above $4,150 or a retest of the $4,000 support zone, using RSI and Bollinger Bands to gauge the next move in ETH’s evolving trend.